Instance Details
The instance detail page is where you can view and fully manage an instance. To get to an instance detail page, navigate to , and click on an Instance. Please note Instance details and actions will differ between Instance types and user permissions.
There are several sections within an Instance page that provide useful capabilities to the user.
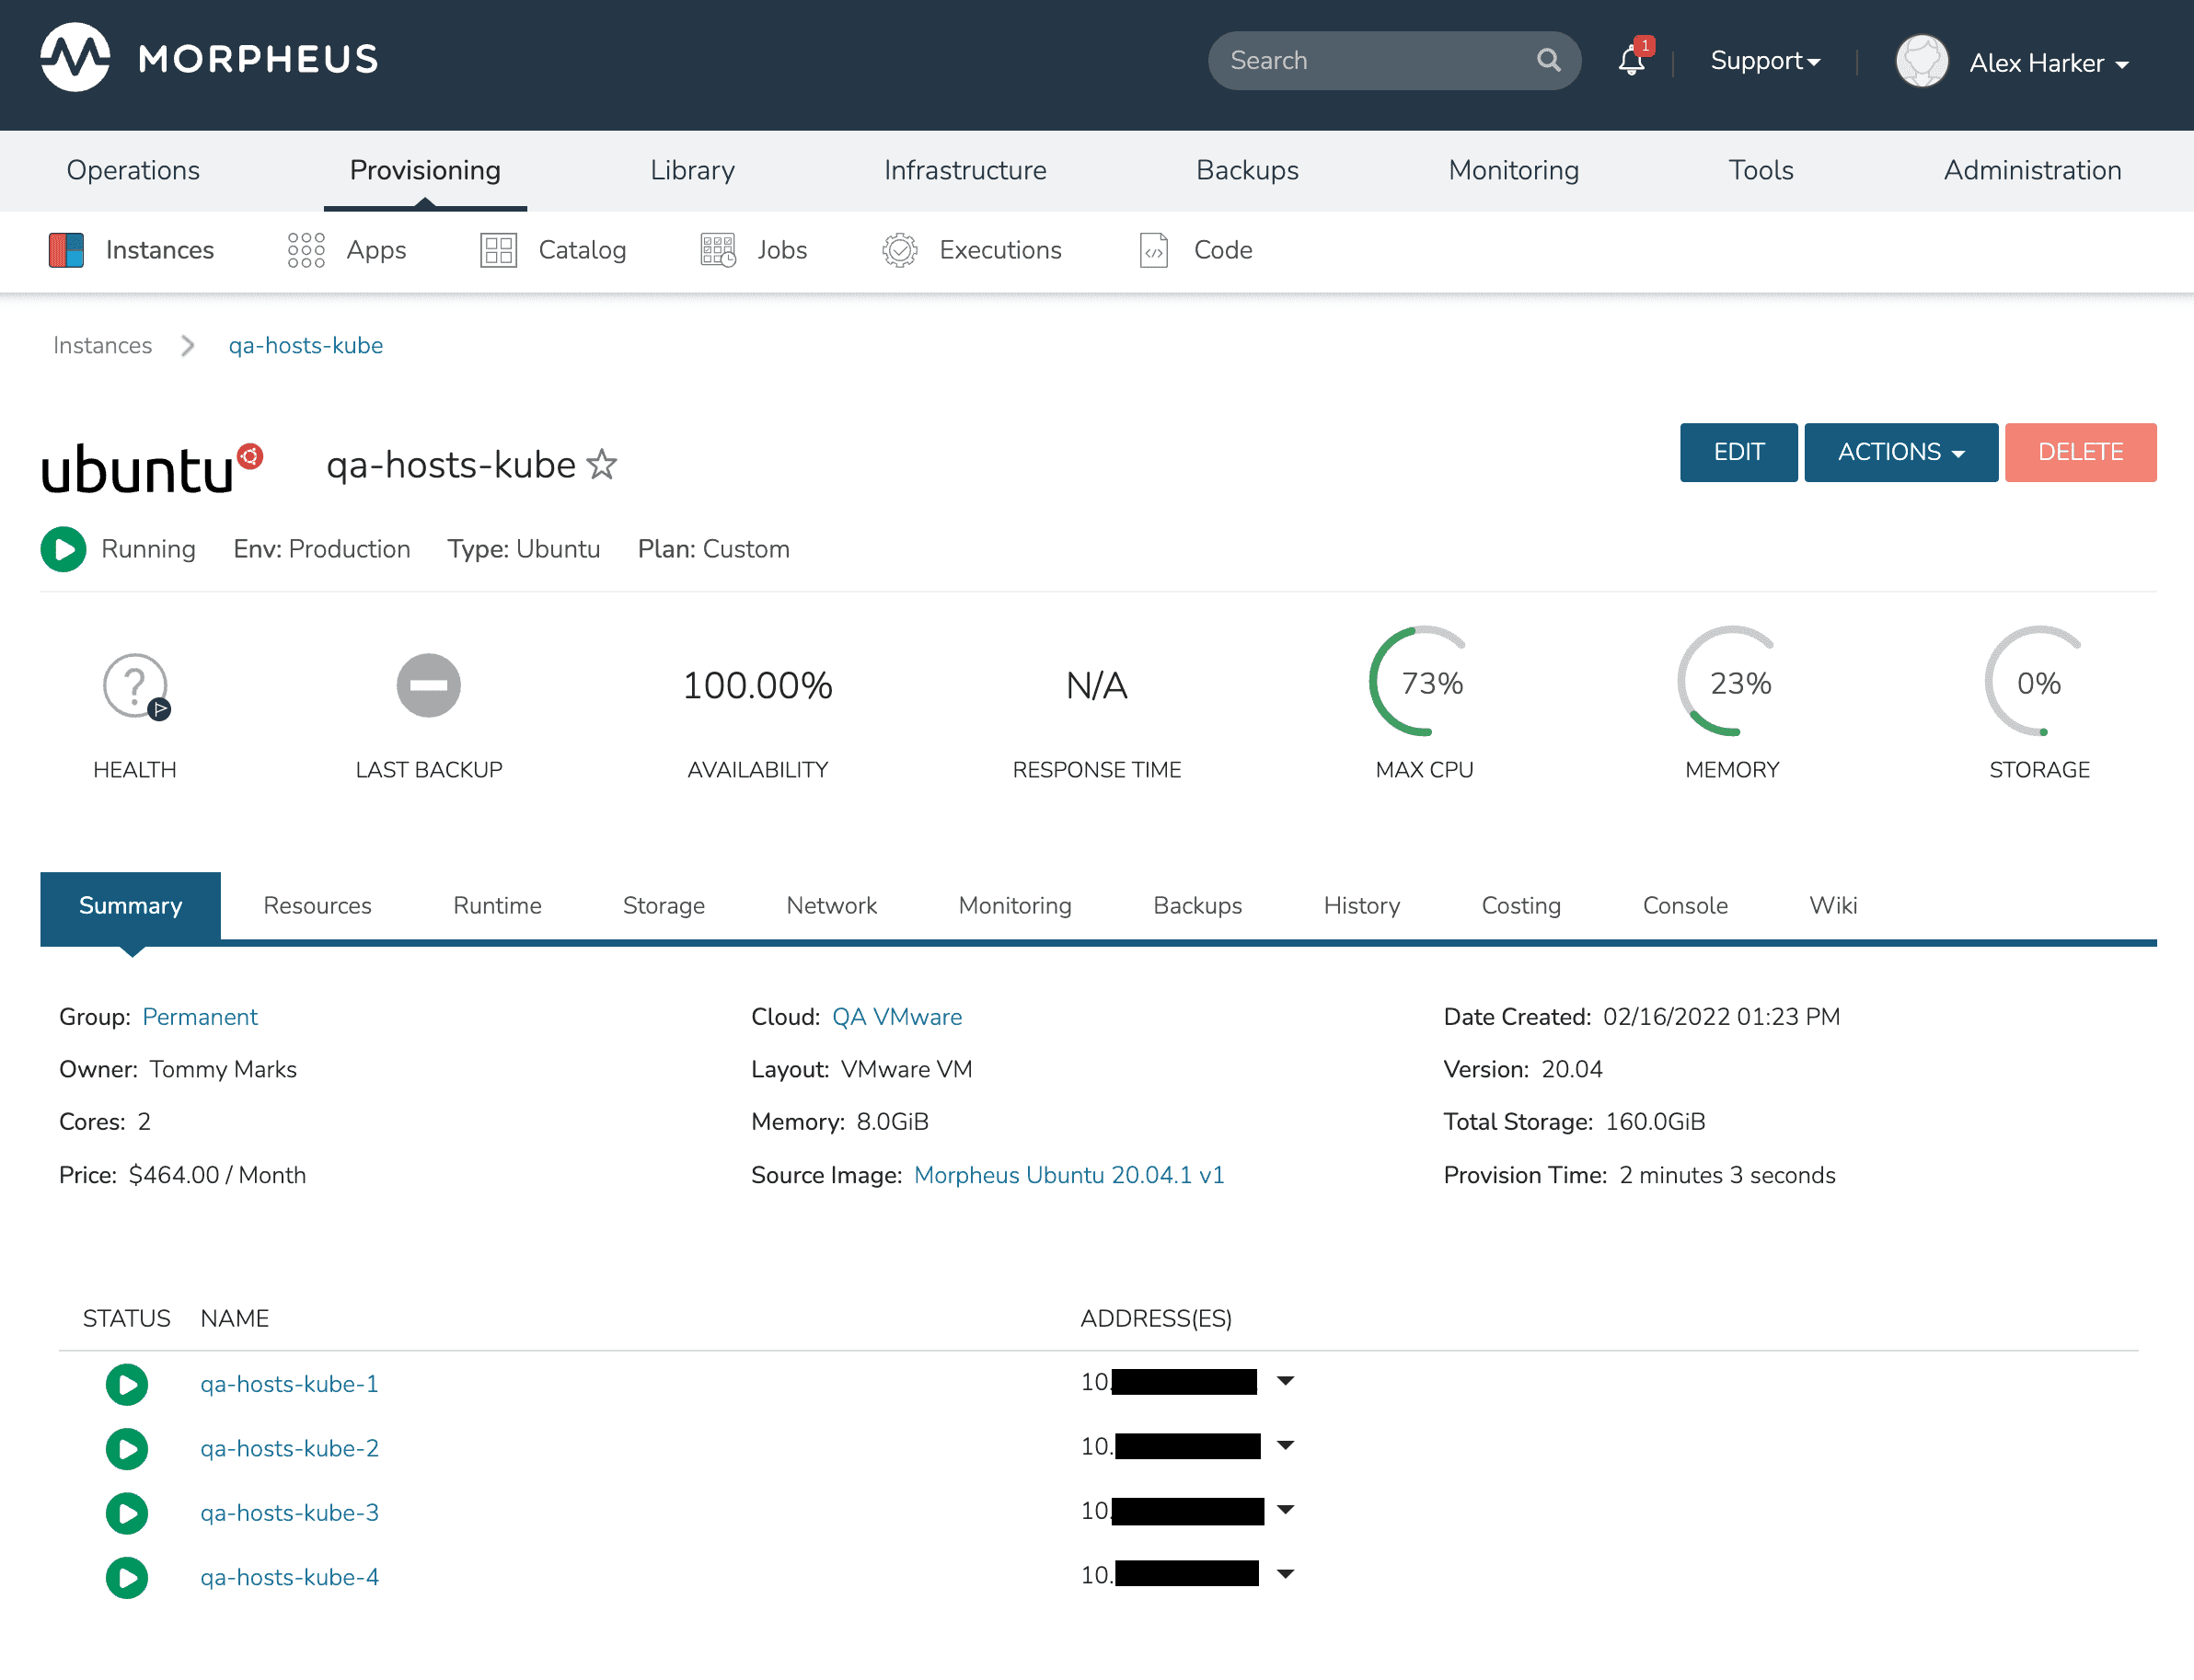
- Summary
Basic information, stats and status information
Availability: The Instance availability is the percentage of time the Instance is up. When stopping Instances, the option is given to mute monitoring if you wish for intentional down time not to count against the availability
Response Time: If listed as “N/A” (Not Applicable), the Instance does not have any Checks set against it or does not have any Checks set against it that report a response time. Agent Checks, for example, do not report a response time. Some Checks, such as Docker Checks for Docker containers, require HPE Morpheus Software to ping the container which reports a response time.
- Deploy
Track deployment history for instance types that support deployments or manually kick off a deployment (only visible for Instance Types that support deployments)
- Settings
Some Instance Types support custom configuration settings (for example, MySQL presents the my.ini)
- Resources
VMs, containers, or other resources associated with the Instance are listed here. Some Instance Types, such as XaaS Instances, will not have resources and the tab is not displayed
- Runtime
View the environment variables presented to the Instances or exported to the Instances via Apps (more on this in the Apps section). Users may also see Imported environment variables that may be referenced by the running Instance.
For Instances that support load balancing and auto scaling, configure auto scaling thresholds and load balancer settings in the Scale subsection that pertain to a particular Instance.
The software subsection will show any tracked software which is Installed as part of the provisioning process and is being tracked.
- Storage
See storage information associated with the Instance including the list of volumes and controllers which are associated with each machine that makes up the Instance.
- Network
Useful for configuring network interfaces for your VMs or security groups which allow access to the Instance.
- Monitoring
Quick summary of the monitoring system and all checks that were configured to test the state of the Instance. Stats views (memory, cpu, etc.) can be zoomed out to a 90-day view if desired (in global settings, ensure your stats retention setting will support this). Logs and guidance for the individual Instance are also shown in their respective subtabs.
- Backups
Quick backup dashboard. Useful for viewing historical backups and snapshots as well as adding new backup jobs. For layouts that support snapshots, users with Snapshots: Full permission can start one from Actions > Create Snapshot; see Managing Instances.
- History
See historical information related to automation which has been run against the Instance. This is useful for examining automation which was run as part of a phase of a Provisioning Workflow. Users can also drill into the Workflows to examine individual Tasks, including viewing the output from these Tasks to confirm success or troubleshoot issues.
- Costing
Invoices pertaining to the Instance are displayed here. See the Instance level or host level invoices along with individual line items. In the History subtab view historical pricing data to monitor trends. In the Prices subtab view any prices which have been created and used to build a metered costing profile for the workload.
- Console
Access the Instance or container via a client-less Console supporting SSH, RDP, VNC, or even hypervisor-level remote consoles.
- Wiki
View the Wiki page for this Instance or edit the existing Wiki page (which may currently be blank). The content field supports markdown formatting, see the main Wiki section of HPE Morpheus Software documentation for additional details.