Health
HPE Morpheus Software Health
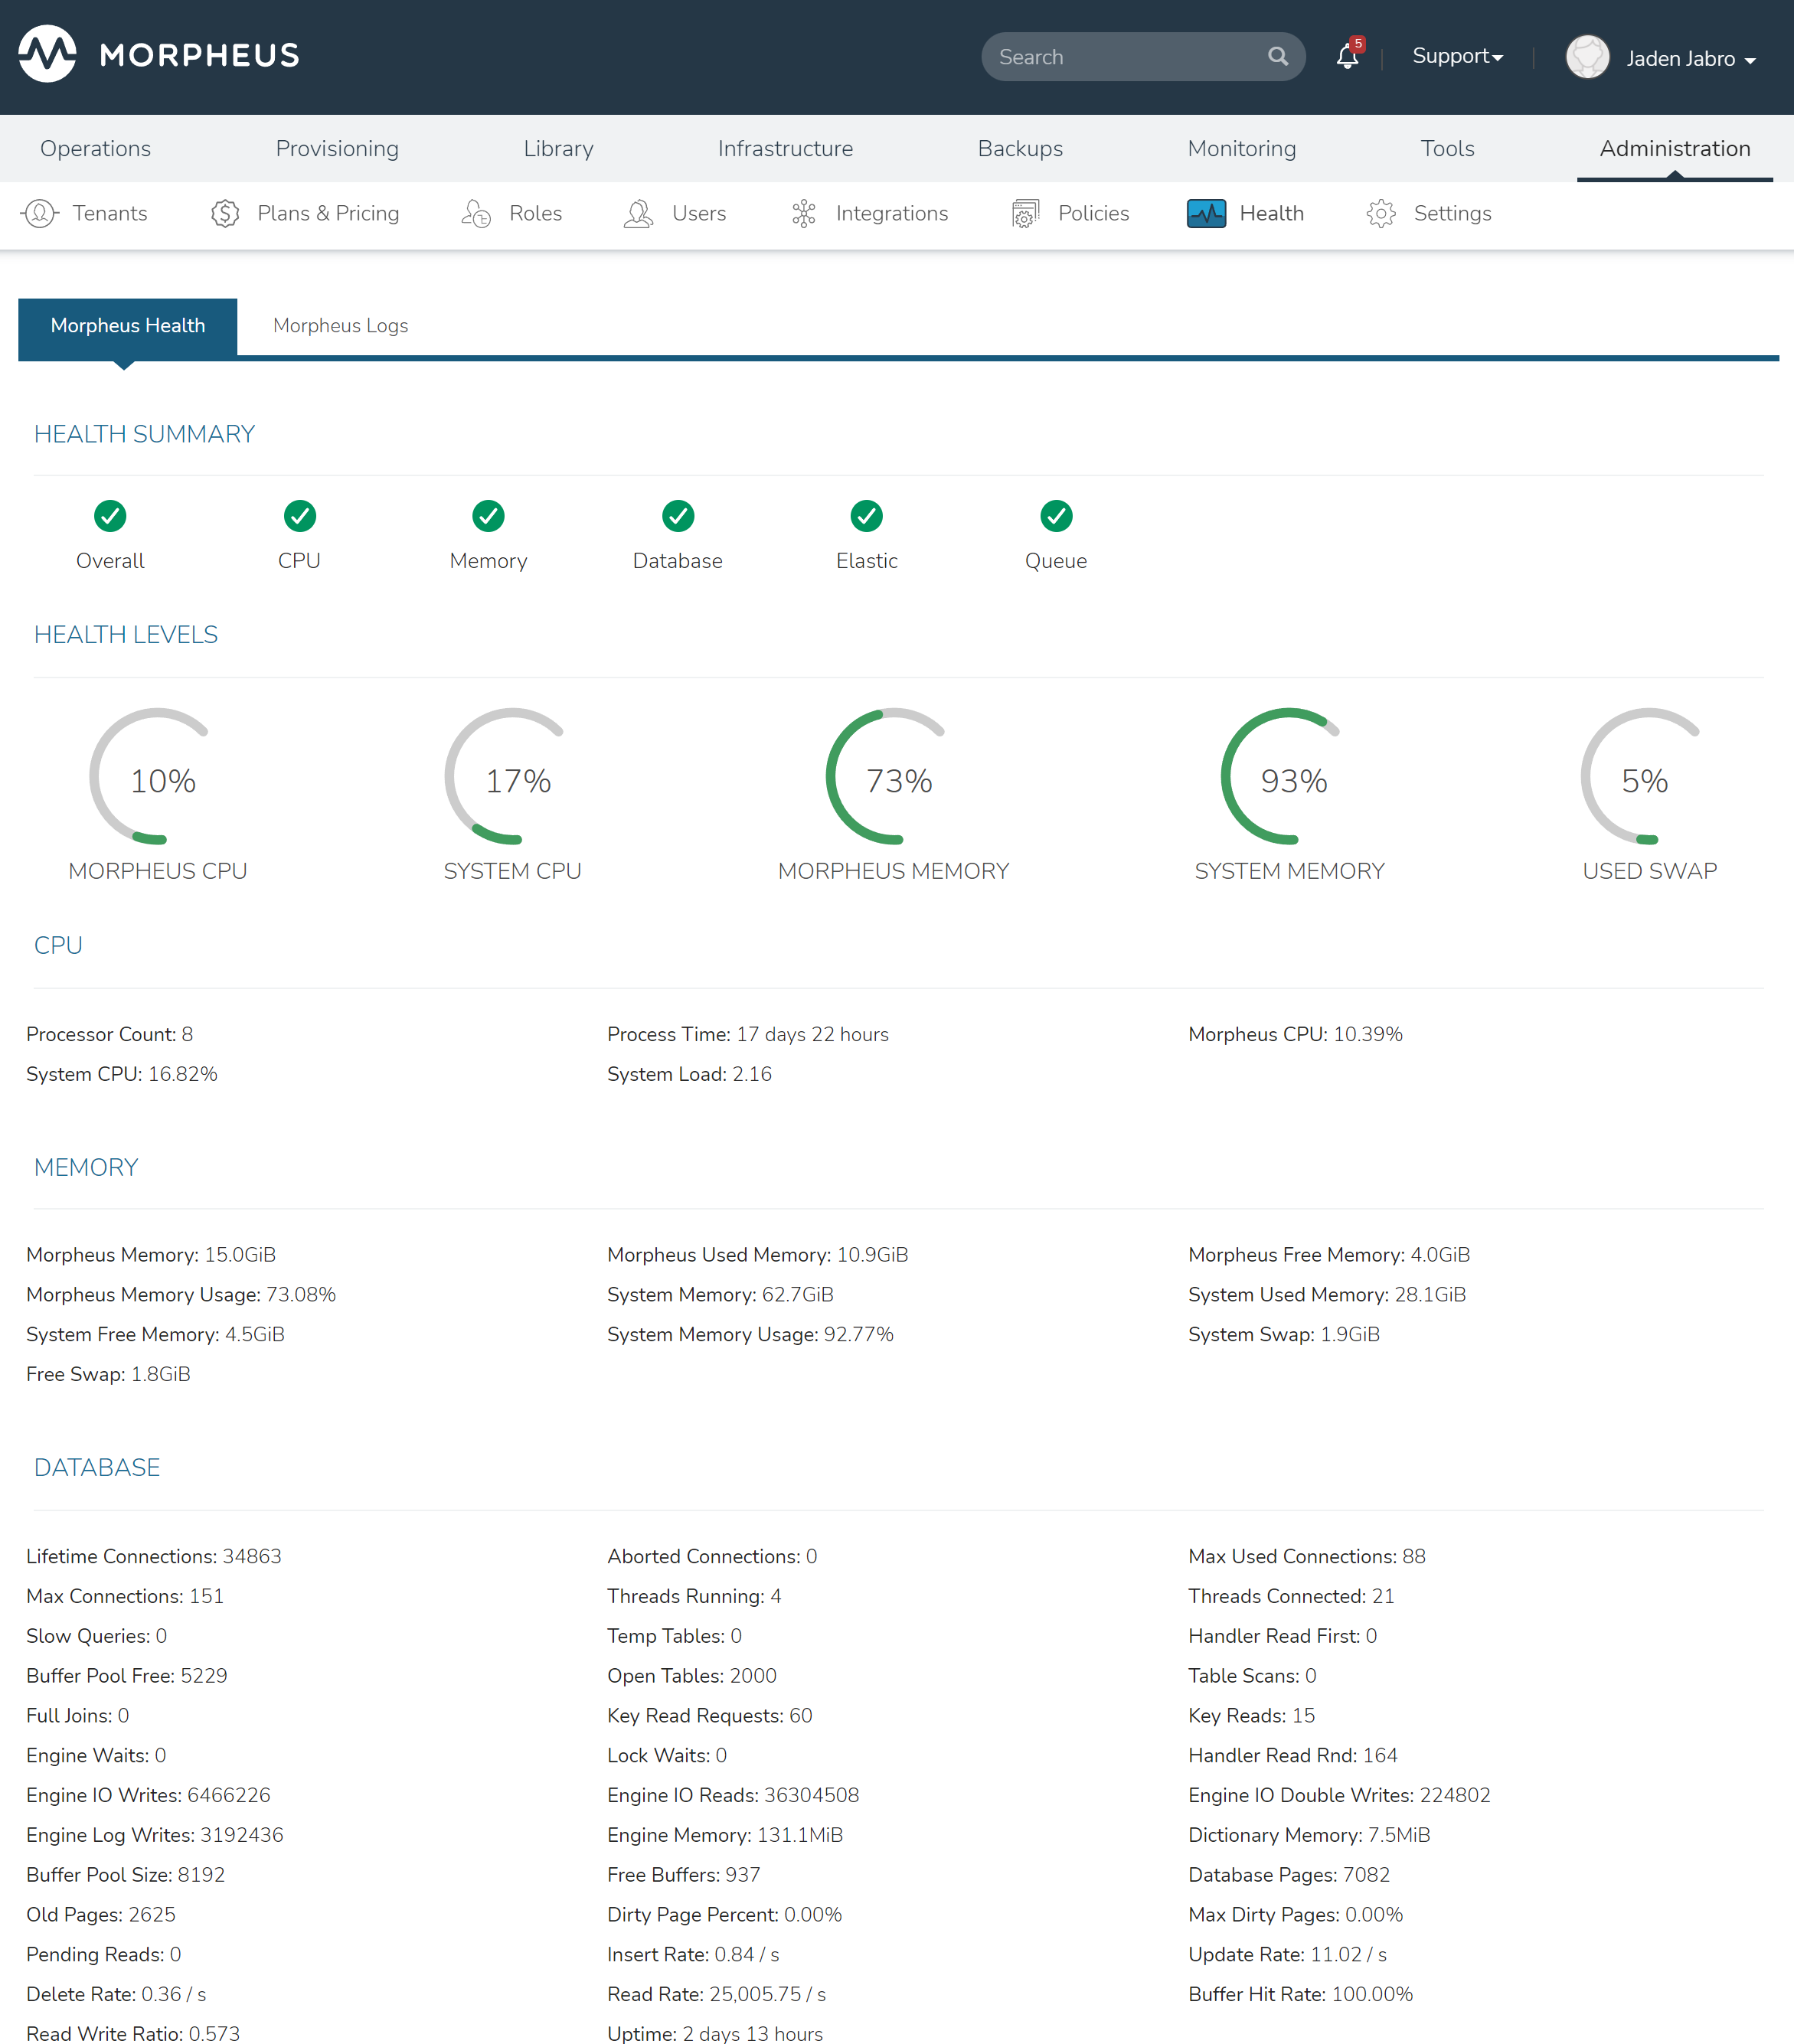
The HPE Morpheus Software Health section provides an overview of the health of your HPE Morpheus Software appliance. It includes an appliance health summary in the following areas:
CPU: Appliance CPU usage is checked. If usage is greater than 50%, this indicator will be in a yellow or warning state. If HPE Morpheus Software is unable to complete the check, it will be in a red or error state. Depending on appliance performance and how frequently this indicator is in a warning state, it may be necessary to upgrade to increase CPU. The Overall health indicator will mirror the CPU health indicator
Memory: If swap usage is above 60% or HPE Morpheus Software memory usage is above 95%, this indicator will be in a yellow or warning state. If HPE Morpheus Software is unable to complete the check for any reason, it will be in a red or error state. Depending on appliance performance and how frequently this indicator is in a warning state, it may be necessary to increase swap, upgrade the appliance to add memory, or consider a different appliance architecture for those using single-node appliances
Storage: If utilization of the filesystem mounted at “/” exceeds 80%, this indicator will be in a yellow warned status. Above 90% will put this indicator in red or error status
Database: The database is checked. If the number of database connections exceeds the configured maximum number of connections or if any test queries are reported as being slow, this indicator will be in a yellow or warning state. If HPE Morpheus Software is unable to communicate with the database, it will be in a red or error state. In the database section further down the page, you can check the number of maximum used connections against the number of max connections. In the case of database connections exceeding the maximum, consider increasing the maximum settings connection
Elastic: Elasticsearch is polled for the health status of each index. If any indices are not reporting a “green” health status, this indicator will be in a yellow or warning state.
Queues: RabbitMQ queues are checked. Any queues containing more than 1000 messages are considered to be in an error state. Appliance Queue health is given in a yellow or warning status when any queues are in such an error state. In the Queues section further down the page you can see the individual Queues listed and which have messages piling up. When the appliance is unable to complete the check for any reason, this indicator will be in a red or error state
Health Levels
Health levels provide a live representation of the current memory and CPU load on the appliance. In an HA appliance, this data is specific to the application node serving the request. The base product does not identify that node on this page. Use load-balancer access logs and appliance logs to correlate a request with an application node; do not depend on an unmaintained forum plugin for this operational decision.
Morpheus CPU: Instantaneous amount of CPU capacity in use by HPE Morpheus Software processes
System CPU: Instantaneous amount of CPU capacity in use by all processes
Morpheus Memory: JVM maximum heap for the HPE Morpheus Software application process on the application node serving the page (see the metric definitions below)
System Memory: Instantaneous amount of total system memory currently claimed (this is commonly a high percentage, see the TIP box below)
Used Swap: Instantaneous amount of total available system swap in use
Storage: The instantaneous percentage utilization of the filesystem mounted at “/”
Tip
High system-memory utilization alone does not establish appliance pressure because operating-system usage includes caches and processes outside the application JVM. Use the metric definitions and warning guidance below. If warnings persist with degraded behavior, collect a support bundle and open a case through the HPE Support Center.
Additional System Health Indices
Memory metric definitions
Displayed metric |
Current calculation |
Scope and interpretation |
|---|---|---|
Morpheus Memory |
JVM maximum memory ( |
Upper heap limit for the HPE Morpheus Software application process on the application node serving the page. |
Morpheus Used Memory |
JVM total memory minus JVM free memory |
Heap currently committed to the JVM and occupied. This is not total resident memory for every appliance service. |
Morpheus Free Memory |
|
Free space inside the currently committed JVM heap, not all memory available before the heap reaches its maximum. |
Morpheus Memory Usage |
Morpheus Used Memory / JVM total memory × 100 |
Percentage of the currently committed heap, not of Morpheus Memory (the maximum heap). |
System Memory |
Operating-system total physical memory |
Host or container-visible physical-memory scope for the current application node. |
System Used Memory |
System Memory minus System Free Memory |
Includes the OS, caches, and all visible processes. |
System Free Memory |
Operating-system free physical memory |
Does not represent JVM free heap. |
System Memory Usage |
(System Memory - System Free Memory) / System Memory × 100 |
Whole node/container-visible usage. |
System Swap / Free Swap |
OS total swap / OS free swap |
Swap visible to the current node. |
The values do not form one arithmetic breakdown: JVM totalMemory is committed heap, JVM maxMemory is a limit, and system values include other processes and caches. They are sampled when health data is loaded. In HA deployments, each application node has its own JVM and system sample; compare the node that raised the warning rather than adding values across nodes.
Memory warning decisions
The current health implementation reports a warning when used swap is greater than 60% of total swap. If that test is not met, it reports a warning when Morpheus Used Memory is greater than 95% of the JVM’s currently committed total memory. These tests are ordered; the displayed message identifies the first matched condition. A collection error produces an error state rather than a utilization warning.
Treat an isolated high value as a point-in-time signal. Check whether the warning persists, review application performance and garbage-collection behavior, and collect a support bundle before changing memory limits. For sustained swap pressure, investigate host/container memory pressure and competing processes. For sustained Morpheus heap pressure with degraded behavior, engage support to review sizing before increasing the application memory limit. Health thresholds are appliance alarms and are unrelated to workload resize Guidance thresholds.
- CPU
Processor Count
Process Time
Morpheus CPU
System CPU
System Load
- MEMORY
Morpheus Memory
Morpheus Used Memory
Morpheus Free Memory
Morpheus Memory Usage
System Memory
System Used Memory
System Free Memory
System Memory Usage
System Swap
Free Swap
- DATABASE
Lifetime Connections
Aborted Connections
Max Used Connections
Max Connections
Threads Running
Threads Connected
Slow Queries
Temp Tables
Key Reads
Handler Reads
Buffer Pool Free
Open Tables
Table Scans
Full Joins
Key Read Requests
Key Reads
Engine Waits
Lock Waits
Handler Reads
Engine IO Writes
Engine IO Reads
Engine IO Double Writes
Engine Log Writes
Engine Memory
Dictionary Memory
Buffer Pool Size
Free Buffers
Database Pages
Old Pages
Dirty Page Percent
Max Dirty Pages
Pending Reads
Insert Rate
Update Rate
Delete Rate
Read Rate
Buffer Hit Rate
Read Write Ratio
Uptime
- ELASTIC
Status
Cluster
Node Count
Data Nodes
Shards
Primary Shards
Relocating Shards
Initializing
Unassigned
Pending Tasks
Active Shards
Note
Warning status is typical for Elasticsearch
- Elastic Nodes
Node
Master
Location
Heap Usage
Memory Usage
CPU Usage
1M Load
5M Load
15M Load
- Elastic Indices
Health
Index
Status
Primary
Replicas
Doc
Count
Primary
Size
Total Size
- Queues
Queue Count
Busy Queues
Error Queues
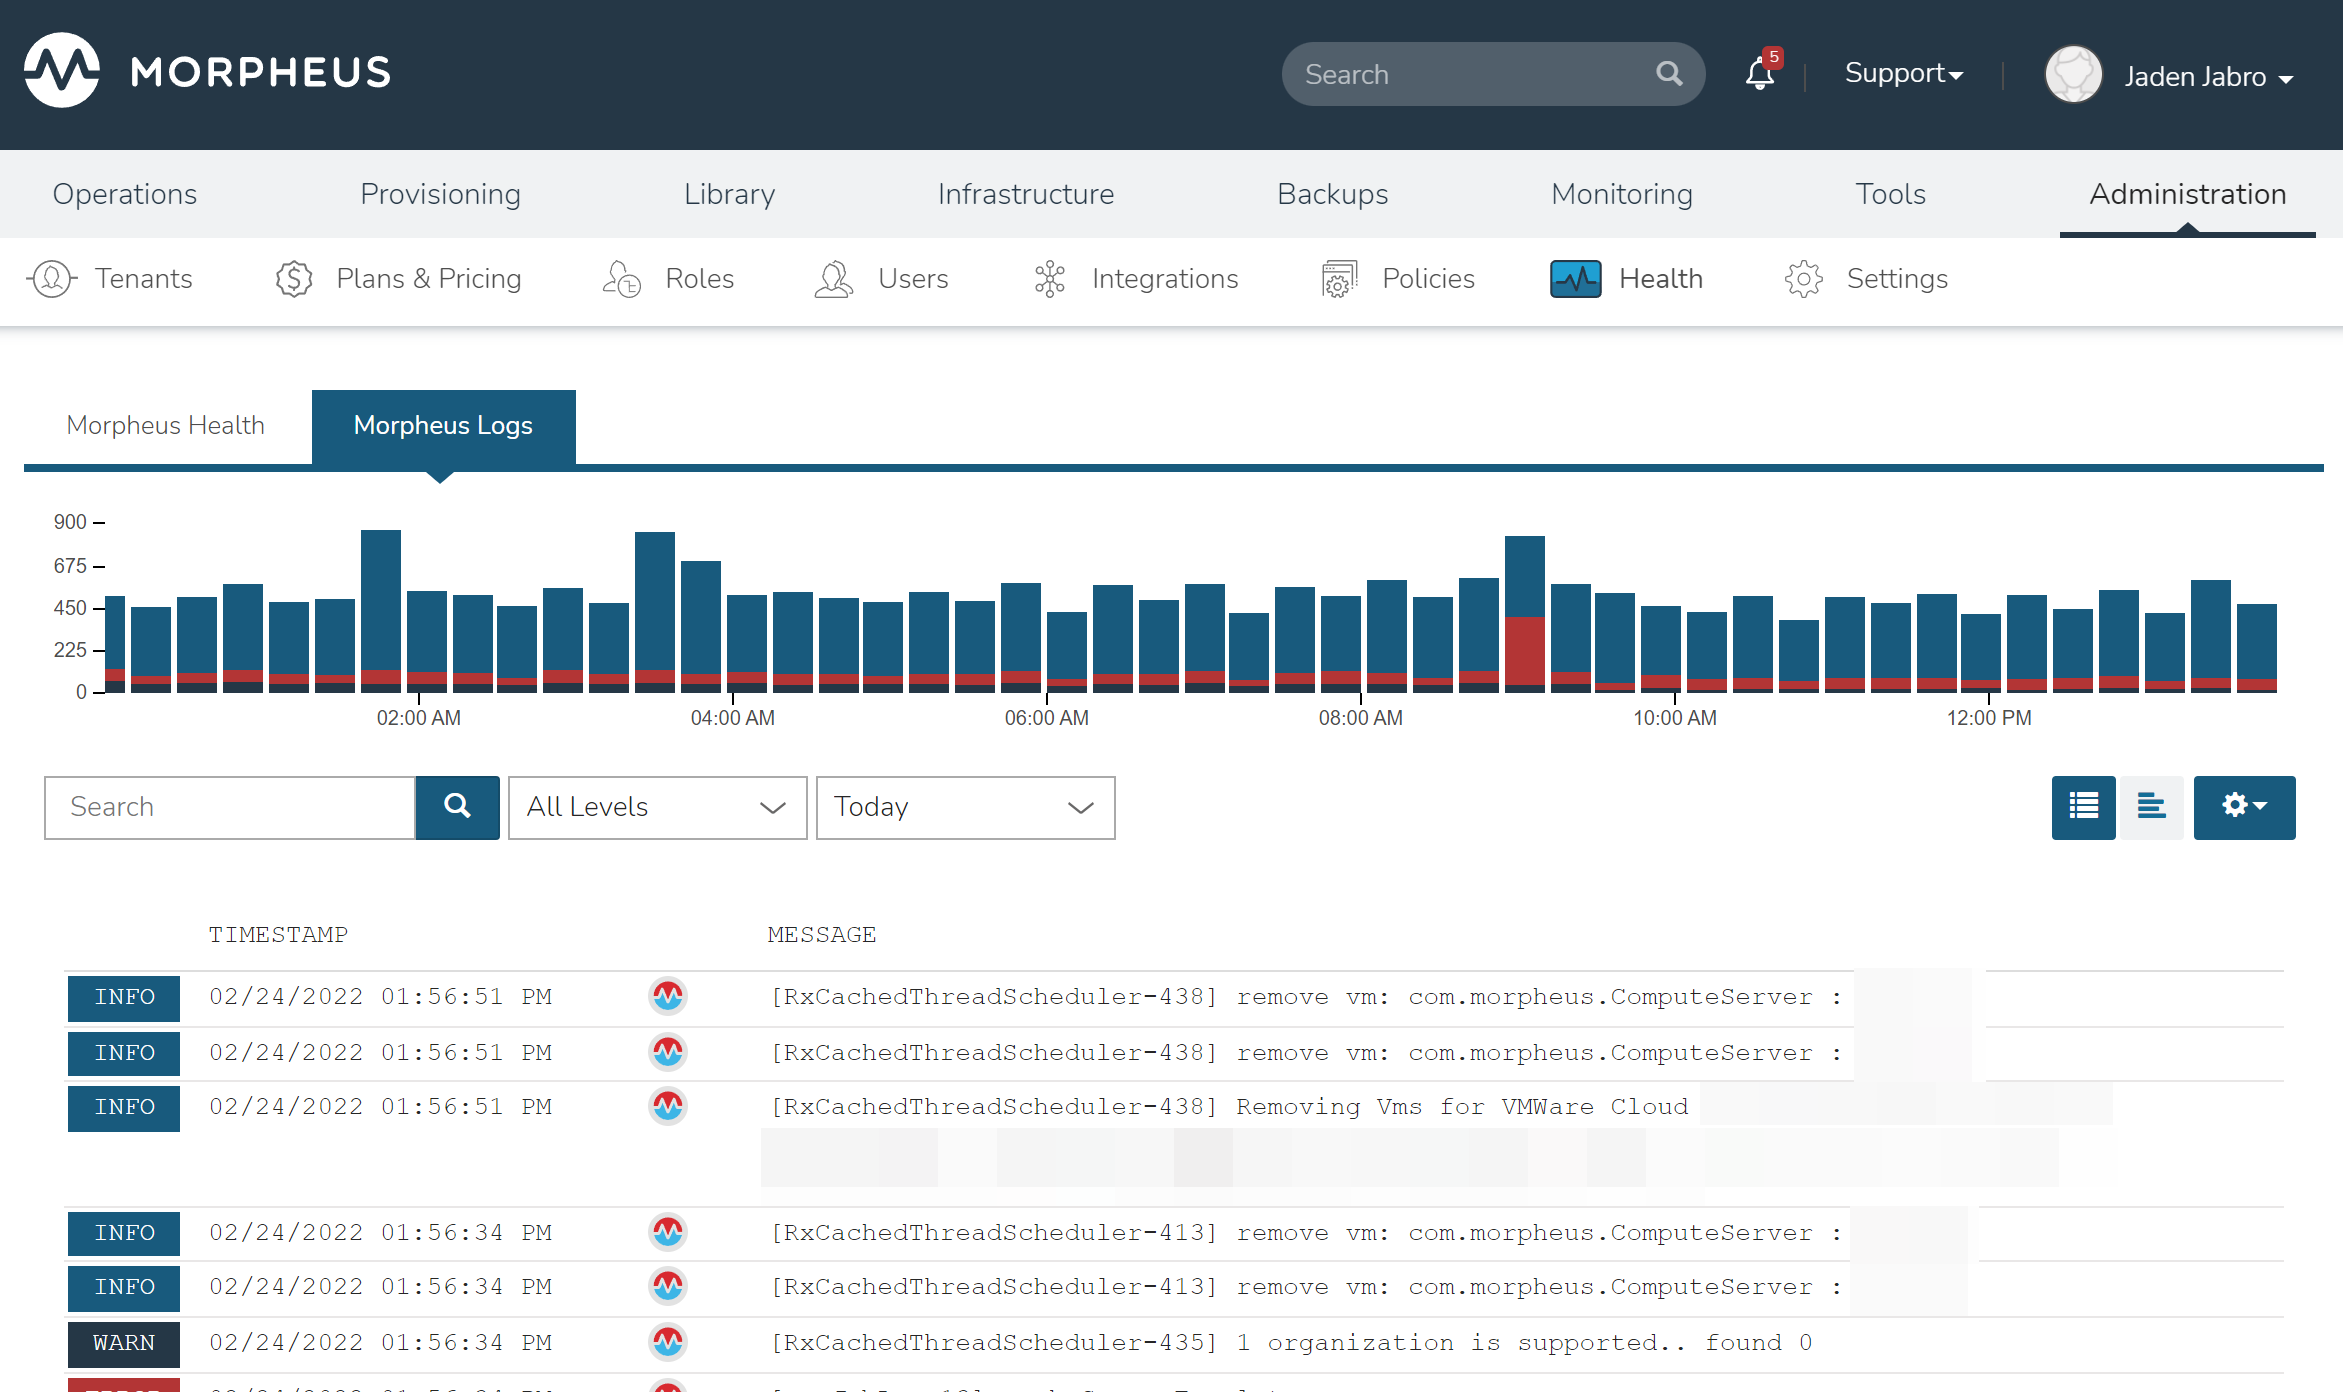
HPE Morpheus Software Logs
The HPE Morpheus Software logs section aggregates appliance-specific logs into one list. If needed, users can export the logs by clicking EXPORT. This action triggers a download containing the last 10,000 log entries as a .log file.